
Teach lesson
Pendulum: model, T², and effective length
Upper-secondary (1º Bachillerato) activity that uses the Pendulum remote lab to measure periods, linearise with T², and discuss how far the ideal model fits.
Sign in with an educator account to prepare a class session. Students join with a class code.
New to LabsLand? Create your teacher account
Learning Outcomes
Measure periods from the Pendulum remote lab while keeping the initial angle constant.
Calculate T² from the mean period and use it to analyse the relationship with effective length.
Separate experimental evidence, the ideal model, and the limitations of a real pendulum.
Decide whether the data support a relationship consistent with T² proportional to effective length, without overstating accuracy.
Design an improved experiment to estimate a slope or g if reliable effective lengths are available.
Student activity preview
Activity Content
Preview only. In a class session, students can fill in responses and submit their work to the teacher.
Model before measuring
10 min
In this activity you go a step beyond comparing whether a short pendulum swings faster. You will use the remote lab to ask:
Are the real pendulum data consistent with T² increasing when effective length increases?
The ideal simple-pendulum model, for small angles, is usually written as:
T = 2π√(L/g)
If you square it:
T² = (4π²/g) · L
This means that, in the ideal model, T² should be proportional to the length L. In the real lab you do not always have a direct, exact physical length for each configuration. So in this activity you will separate three things:
- Experimental data: times read in the lab and periods you calculate.
- Comparison variable: the configuration or relative effective length of the pendulum.
- Ideal model: the idea that
T²grows approximately in proportion toLif the model's assumptions hold.
Write your prediction before measuring. Answer in 3 or 4 sentences: explain what you expect to happen to the period T and to T² as the effective length increases, and name one assumption of the ideal model that might not hold exactly in the lab.
Identify the variables. Answer as a list: independent variable, main dependent variable, the variable transformed for the model, and at least three control variables.
Measure in the lab
18 min
Use the initial angle fixed at 15 degrees. That way you do not mix the effect of effective length with the effect of amplitude.
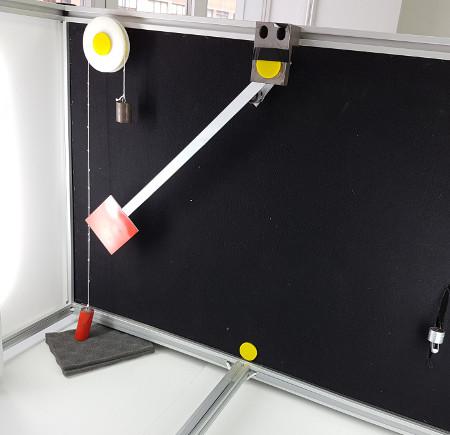
The lab lets you compare configurations such as short, standard, and the soda-can positions. For this activity use at least four configurations if your access allows it. If the teacher prefers a short route, use short, standard, and two soda-can positions. If you only have demo access, you will not be able to complete the full route, because demo mode only allows the standard pendulum at 15 degrees.
Open the Pendulum lab
Open the lab, select a configuration, leave the angle at 15 degrees, and observe the graph of angle against time. Repeat the process for each configuration you are going to compare.
Choose the best strategy to keep the comparison fair.
Data, T, and T²
20 min
First complete the measurements table. Each row is one configuration and one trial. In configuration, write the name shown in the lab or a clear label from your teacher. In initial angle, write 15. In oscillations, write how many complete oscillations you counted. In start time and end time, copy your readings from the graph or chronometer. Calculate interval = end time - start time, T = interval / oscillations, and T² = T · T. In evidence, write whether you used peaks, troughs, zero crossings, the video chronometer, or teacher backup data.
Measurements for the T² model
Complete at least eight rows: two trials for four configurations. Use seconds. Keep 15 degrees and the same reading rule. Calculate T and T² in each row.
| Configuration | Trial | Initial angle degrees | Complete oscillations | Start time s | End time s | Interval s | T s | Per-trial T² (not used in the graph) s² | Evidence used |
|---|---|---|---|---|---|---|---|---|---|
Now summarise by configuration. The table has one row per configuration. In periods used, copy the periods from the table above. In mean T, calculate the mean. In (mean T)², calculate the square of the mean period. In range of T, subtract the smallest period from the largest for that configuration. In effective length or label, write a comparison label (short, standard, soda up, etc.) or a numeric effective length only if your teacher provides it from a reliable source.
Summary for T² against effective length
Complete one row per configuration. Calculate mean T, (mean T)², and the range of T. Do not invent lengths: use comparison labels unless the teacher provides reliable effective lengths. For each configuration, first average the measured periods T, then square that mean. Use (mean T)² in the summary and graph, not the mean of the individually squared periods. Keep full precision until the final reported value.
| Effective length or label | Configuration | Periods used s | Mean T s | (Mean T)² s² | Range of T s | Source of length/data |
|---|---|---|---|---|---|---|
For one configuration, enter (mean T)² in s². Show the two measured periods, their mean, and then the square of that mean. Do not average the two per-trial squares.
Compare the difference between two configurations with the range of your measurements. Answer in 3 or 4 sentences: quote two values of mean T, quote at least one range, and decide whether the difference between configurations looks larger than the reading uncertainty.
Graph of T² against effective length
12 min
Build a graph with (mean T)² on the vertical axis. On the horizontal axis use the effective length if your teacher gave it to you from a reliable source. If you do not have numeric lengths, use configuration labels in a reasoned order and make it clear that you are not estimating a physical slope or g.
T²-effective length graph
Submit evidence of your graph: an image, a screenshot, a link to a spreadsheet, or a complete description. The evidence must show what you put on each axis and which configurations appear. If you used numeric lengths, state their source.
Interpret the graph. Answer in 4 or 5 sentences: describe whether T² increases as you move to configurations of greater effective length, identify a point that fits worse or has more uncertainty, and explain whether the graph lets you talk about proportionality or only about a qualitative consistency with the model.
Choose the most rigorous statement for this activity.
Conclusion with model and limitations
10 min
Write a conclusion of 8 to 10 lines with this structure:
- Claim: what relationship you observed between effective length and
T². - Evidence: quote at least three values of
mean Tor(mean T)². - Model: explain why
T²is the right transformed variable for the ideal pendulum. - Limitation: say whether your data allow a quantitative proportionality, an estimate of
g, or only a qualitative consistency, and justify why.
Design to estimate g
10 min
Design an improved version to estimate g. Answer in 5 or 6 sentences: state which effective lengths you would need, how you would check their source, how many configurations and repeats you would use, what graph you would make, how you would obtain the slope, and what uncertainty you would report.
Turn this preview into a live class session
Continue to LabsLand Teach to use this lesson with your students and review the access available to your account.
New to LabsLand? Create your teacher account